Interactive maps
Using ArcGIS Online tools, Cedar Creek can create interactive web maps that graphically depict all kinds of demographic information. Depending on the project, these maps can be embedded into a presentation or story map. Here are a few examples:
Latino Concentrations in Delaware
Prepared for the Episcopal Diocese in Delaware, it led to the decision to focus a new ministry or mission on the Georgetown area
Old Town Laurel properties
This interactive map was prepared in conjunction with the Town of Laurel’s successful application for $500,000 in Strong Neighborhood funds
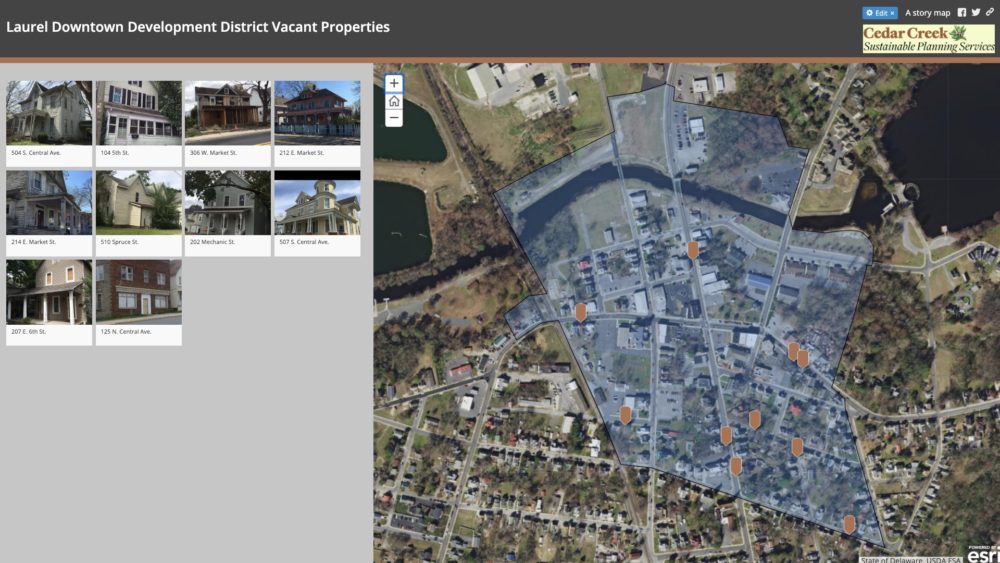
Vacant properties within Laurel’s Downtown Development District (this is a JPG)
The original version was interactive; clicking on the map or the photos revealed information about the parcel, property owner, etc.