Harrington – St. Stephen’s

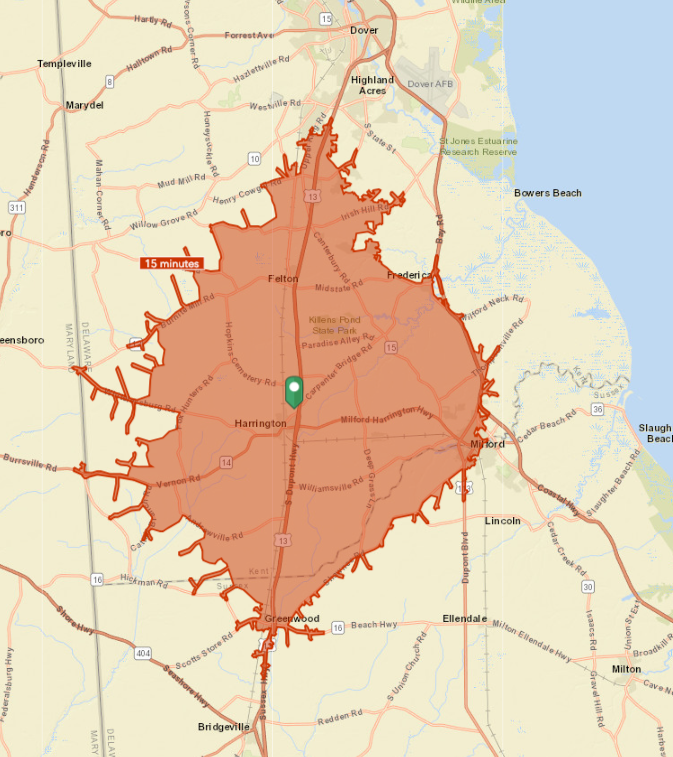
Map showing 15-minute drive time from St. Stephen’s. This is the rule of thumb for how far people are willing to drive to a church.
Links to January 12 presentation:
- The Keynote presentation is at the bottom of the page, uploaded as a video. Just hit pause to review a slide.
- Who lives within 15-minute drive time of St. Stephen’s? Check out the infographic.
- Generations: Baby Boomers vs. Millennials. View the interactive pie chart.
- Lifestyles: Pet ownership, internet access, etc. View infographic.
- Who are our neighbors? The most prevalent lifestyle groups within a 15-mile drive time of St. Stephen’s. More explanation below.
What is Tapestry?
Esri’s Tapestry Segmentation classifies American neighborhoods into categories based on demographics and socioeconomics. Esri, or Environmental Systems Research Institute, is an international supplier of geographic information system (GIS) software, web GIS and geodatabase management applications.
For the area within a 15-minute drive time of St. Stephen’s, the top two Tapestry segments are:
- Southern Satellites, 23.1% or 3,787 households. This rural market is typically nondiverse, slightly older, settled married-couple families, who own their homes. Two-thirds of the homes are single-family structures; almost a third are mobile homes. Residents enjoy country living, preferring outdoor activities and DIY home projects.
- Green Acres, 12.9% or 2,115 households. The Green Acres suburban/rural lifestyle features country living and self-reliance. They are avid do-it-yourselfers, maintaining and remodeling their homes, with all the necessary power tools to accomplish the jobs. Self-described conservatives, residents of Green Acres remain pessimistic about the near future yet are heavily invested in it.
These two categories sound very similar, but there are a few differences in terms of education, home ownership, technology proficiency and other characteristics. They also have elements in common, such as love of the outdoors, do-it-yourself preferences, relative lack of diversity, and conservatism.
What to do with this information. Understand your neighbors, who they are, and what interests them.Contemplate ministries or activities based on these local interests and issues that might attract people from beyond your existing congregation. For example, since there is a prevailing interest in do-it-yourself projects, your neighbors may be interested in anything from a Jesus Was a Carpenter class to getting involved in Habitat for Humanity.
Episcopal Church profile of St. Stephen’s
 The national church also looked the social and demographic characteristics of the local community, to shed light on the people to which we hope to minister. Looking at trends in membership, average worship attendance, and financial giving offers insights into congregational strength and whether current patterns indicate growth, decline or stability.
Here is the profile prepared for a three-mile radius of St. Stephen’s. It was derived from this page on the Episcopal Church website.
The presentation, uploaded as a video. Just hit pause if you need more time to review a slide.


